
Janeiro - Acompanhamento da Safra e Exportações Brasileiras
Overview
Crop development and weather
The crop continues to develop well overall, some irrigation areas, able to be planted earlier, are already being harvested, but the greatest part of the areas still have at least February and March to develop.
Nevertheless, during January, the weather has not been so cooperative. Some complaints can be heard from different sources about the lack of rain and excessive heat in Alta Paulista, that could disturb productivity. While Mogiana is starting to have issues with excessive rain, according to the growers in that area.
The next 10 days are forecasted to be rainy in Alta Paulista, with rains of about 10mm forecasted, which should help. And even more rainy in Mogiana and Middle-Tiete regions, with rains of about 20 to 30mm forecasted.
Overall, the situation remains cautiously optimistic as we move forward into the critical months ahead.
Tax regulations:
Exports:
December figures showed an expected decline in peanut exports, and a slight increase in peanut oil exports.
Now that the whole calendar year export numbers are available, let’s take a look on more detailed comparisons to the exports in the last 3 years, analyzing total volume and main importers, below:
Peanuts
Total
Peanuts export in 2024 x 2023
|
Month |
2024 - (K Tons) |
2023 - (K Tons) |
Var (%) |
|
Jan |
23,0 |
20,7 |
11% |
|
Feb |
17,2 |
15,8 |
9% |
|
Mar |
12,9 |
18,5 |
-30% |
|
Apr |
13,4 |
22,4 |
-40% |
|
May |
18,0 |
27,2 |
-34% |
|
June |
19,0 |
25,5 |
-26% |
|
July |
15,6 |
31,6 |
-51% |
|
Aug |
22,3 |
34,7 |
-36% |
|
Sep |
24,9 |
26,6 |
-6% |
|
Oct |
17,8 |
25,2 |
-29% |
|
Nov |
28,1 |
28,3 |
-1% |
|
Dec |
14,6 |
20,9 |
-30% |
|
Total |
226,8 |
297,5 |
-24% |
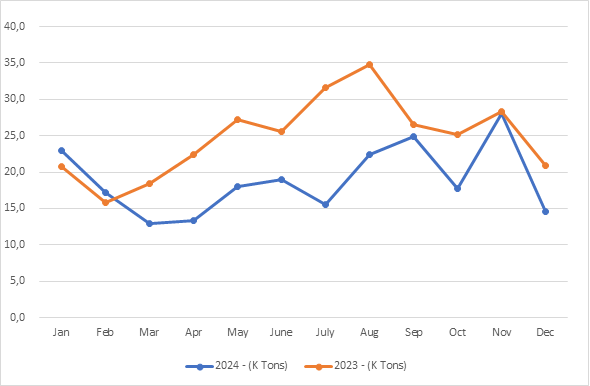
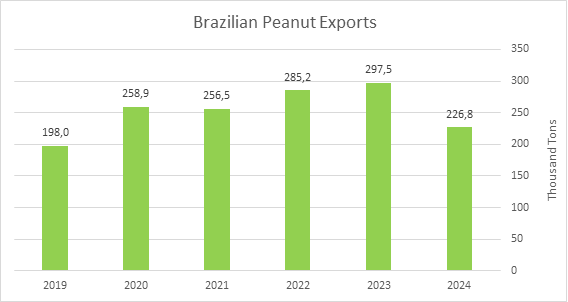
Brazilian exports of peanuts, NCM 12024200, Ministry of Agriculture.
During December, Brazil exported 14,6 K tons, half of the exports in November and 30% less than December 23. This volume adds to a total of about 227 thousand tons exported in 2024, a 24% decrease when compared to 2023.
Brazilian exports of peanuts, NCM 12024200, Ministry of Agriculture.
When compared to the last 5 years of peanut exports, 2024 displays the second lowest volume, beating only 2019. This is due to the low yield of the crop, affected by extreme heat and droughts (especially Alta Paulista region) complemented by the aflatoxin issues that compromised a big part of the overall volume.
Destination
Exported volumes to main destinations.
|
Months |
Russia |
Algeria |
EU27 |
|
January |
7,5 |
0,9 |
6,1 |
|
February |
4,0 |
0,1 |
5,1 |
|
March |
2,8 |
0,6 |
1,8 |
|
April |
3,1 |
2,2 |
1,8 |
|
May |
5,8 |
4,7 |
2,7 |
|
June |
4,5 |
3,4 |
3,3 |
|
July |
4,7 |
1,1 |
3,2 |
|
August |
5,4 |
5,5 |
3,9 |
|
September |
5,8 |
6,8 |
2,9 |
|
October |
5,8 |
3,3 |
2,9 |
|
November |
8,4 |
8,2 |
3,6 |
|
December |
4,6 |
3,9 |
1,4 |
|
Total |
62,3 |
40,7 |
38,7 |
The decrease in exports in December is more than expected, with the stocks coming down and the quality of the peanuts also declining, Russia, Algeria and EU received much fewer tons than in the previous month.
Russia and Algeria dropped by about 4 thousand tons each, while the European Union countries dropped by 2,2 thousand.
When comparing the last 5-year exports to main destinations, 2024 shows the lowest exported volume to Russia, the second lowest exported volume to the EU+UK and a sudden decline in a market that has been increasing for the Brazilian exporters, Algeria.
This recent loss of share in the main importer demands will have to be reverted by the exporters in case the crop confirms to be what everyone has been expecting.
Peanut oil
Peanut Oil export in 2024 x 2023
|
Month |
2024 - (K Tons) |
2023 - (K Tons) |
Var (%) |
|
January |
3,5 |
7,2 |
-51% |
|
February |
3,2 |
7,2 |
-56% |
|
March |
2,9 |
7,4 |
-61% |
|
April |
5,4 |
12,7 |
-57% |
|
May |
6,4 |
9,7 |
-34% |
|
June |
5,4 |
8,8 |
-39% |
|
July |
4,4 |
6,5 |
-32% |
|
August |
4,4 |
5,4 |
-19% |
|
September |
5,4 |
7,6 |
-29% |
|
October |
3,1 |
5,5 |
-44% |
|
November |
2,9 |
5,1 |
-43% |
|
December |
3,7 |
5,8 |
-36% |
|
Total |
50,7 |
88,9 |
-43% |
Destinations
Exported volumes to main destinations so far
|
Month |
China - (K Tons) |
Italy - (K Tons) |
|
Jan |
2,9 |
0,7 |
|
Feb |
1,1 |
1,2 |
|
Mar |
1,0 |
0,5 |
|
Apr |
2,6 |
1,9 |
|
May |
2,0 |
3,2 |
|
Jun |
3,0 |
0,5 |
|
Jul |
3,0 |
0,2 |
|
Aug |
0,9 |
1,6 |
|
Sep |
1,9 |
1,7 |
|
Oct |
1,7 |
1,4 |
|
Nov |
1,9 |
1,0 |
|
Dec |
3,0 |
0,7 |
|
Total |
25,0 |
14,5 |
 Disclaimer: All the information published is checked with many processors and farmers in Brazil, there are no personal opinions but an average of the market’s main players thoughts. January 2nd, 2025.